TensorBoard
Overview
The computations you’ll use TensorFlow for - like training a massive deep neural network - can be complex and confusing. To make it easier to understand, debug, and optimize TensorFlow programs, a suite of visualization tools called TensorBoard is available. You can use TensorBoard to visualize your TensorFlow graph, plot quantitative metrics about the execution of your graph, and show additional data like images that pass through it.
For example, here’s a TensorBoard display for Keras accuracy and loss metrics:

Recording Data
The method for recording events for visualization by TensorBoard varies depending upon which TensorFlow interface you are working with:
| Keras | When using Keras, include the callback_tensorboard() when invoking the fit() function to train a model. See the Keras documentation for additional details. |
| Estimators | When using TF Estimators, TensorBoard events are automatically written to the model_dir specified when creating the estimator. See the Estimators documentation for additional details. |
| Core API | When using the core API, you need to attach tf$summary$scalar operations to the graph for the metrics you want to record for viewing in TensorBoard. See the core documentation for additional details. |
Note that in all cases it’s important that you use a unique directory to record training events (otherwise events from multiple training runs will be aggregated together).
You can remove and recreate event log directories between runs, or alternatively use the tfruns package to do training, which will automatically create a new directory for each training run.
Viewing Data
To view TensorBoard data for a given set of runs you use the tensorboard() function, pointing it to to a directory which contains TensorBoard logs:
tensorboard("logs/run_a")It’s often useful to run TensorBoard while you are training a model. To do this, simply launch tensorboard within the training directory right before you begin training:
# launch TensorBoard (data won't show up until after the first epoch)
tensorboard("logs/run_a")

# fit the model with the TensorBoard callback
history <- model %>% fit(
  x_train, y_train,
  batch_size = batch_size,
  epochs = epochs,
  verbose = 1,
  callbacks = callback_tensorboard("logs/run_a"),
  validation_split = 0.2
)
Keras writes TensorBoard data at the end of each epoch so you won’t see any data in TensorBoard until 10-20 seconds after the end of the first epoch (TensorBoard automatically refreshes it’s display every 30 seconds during training).
tfruns
If you are using the tfruns package to track and manage training runs then there are some shortcuts available for the tensorboard() function:
tensorboard()                                # views the latest run by default
tensorboard(latest_run())                    # view the latest run
tensorboard(ls_runs(order = eval_acc)[1,])   # view the run with the best eval_acc
Comparing Runs
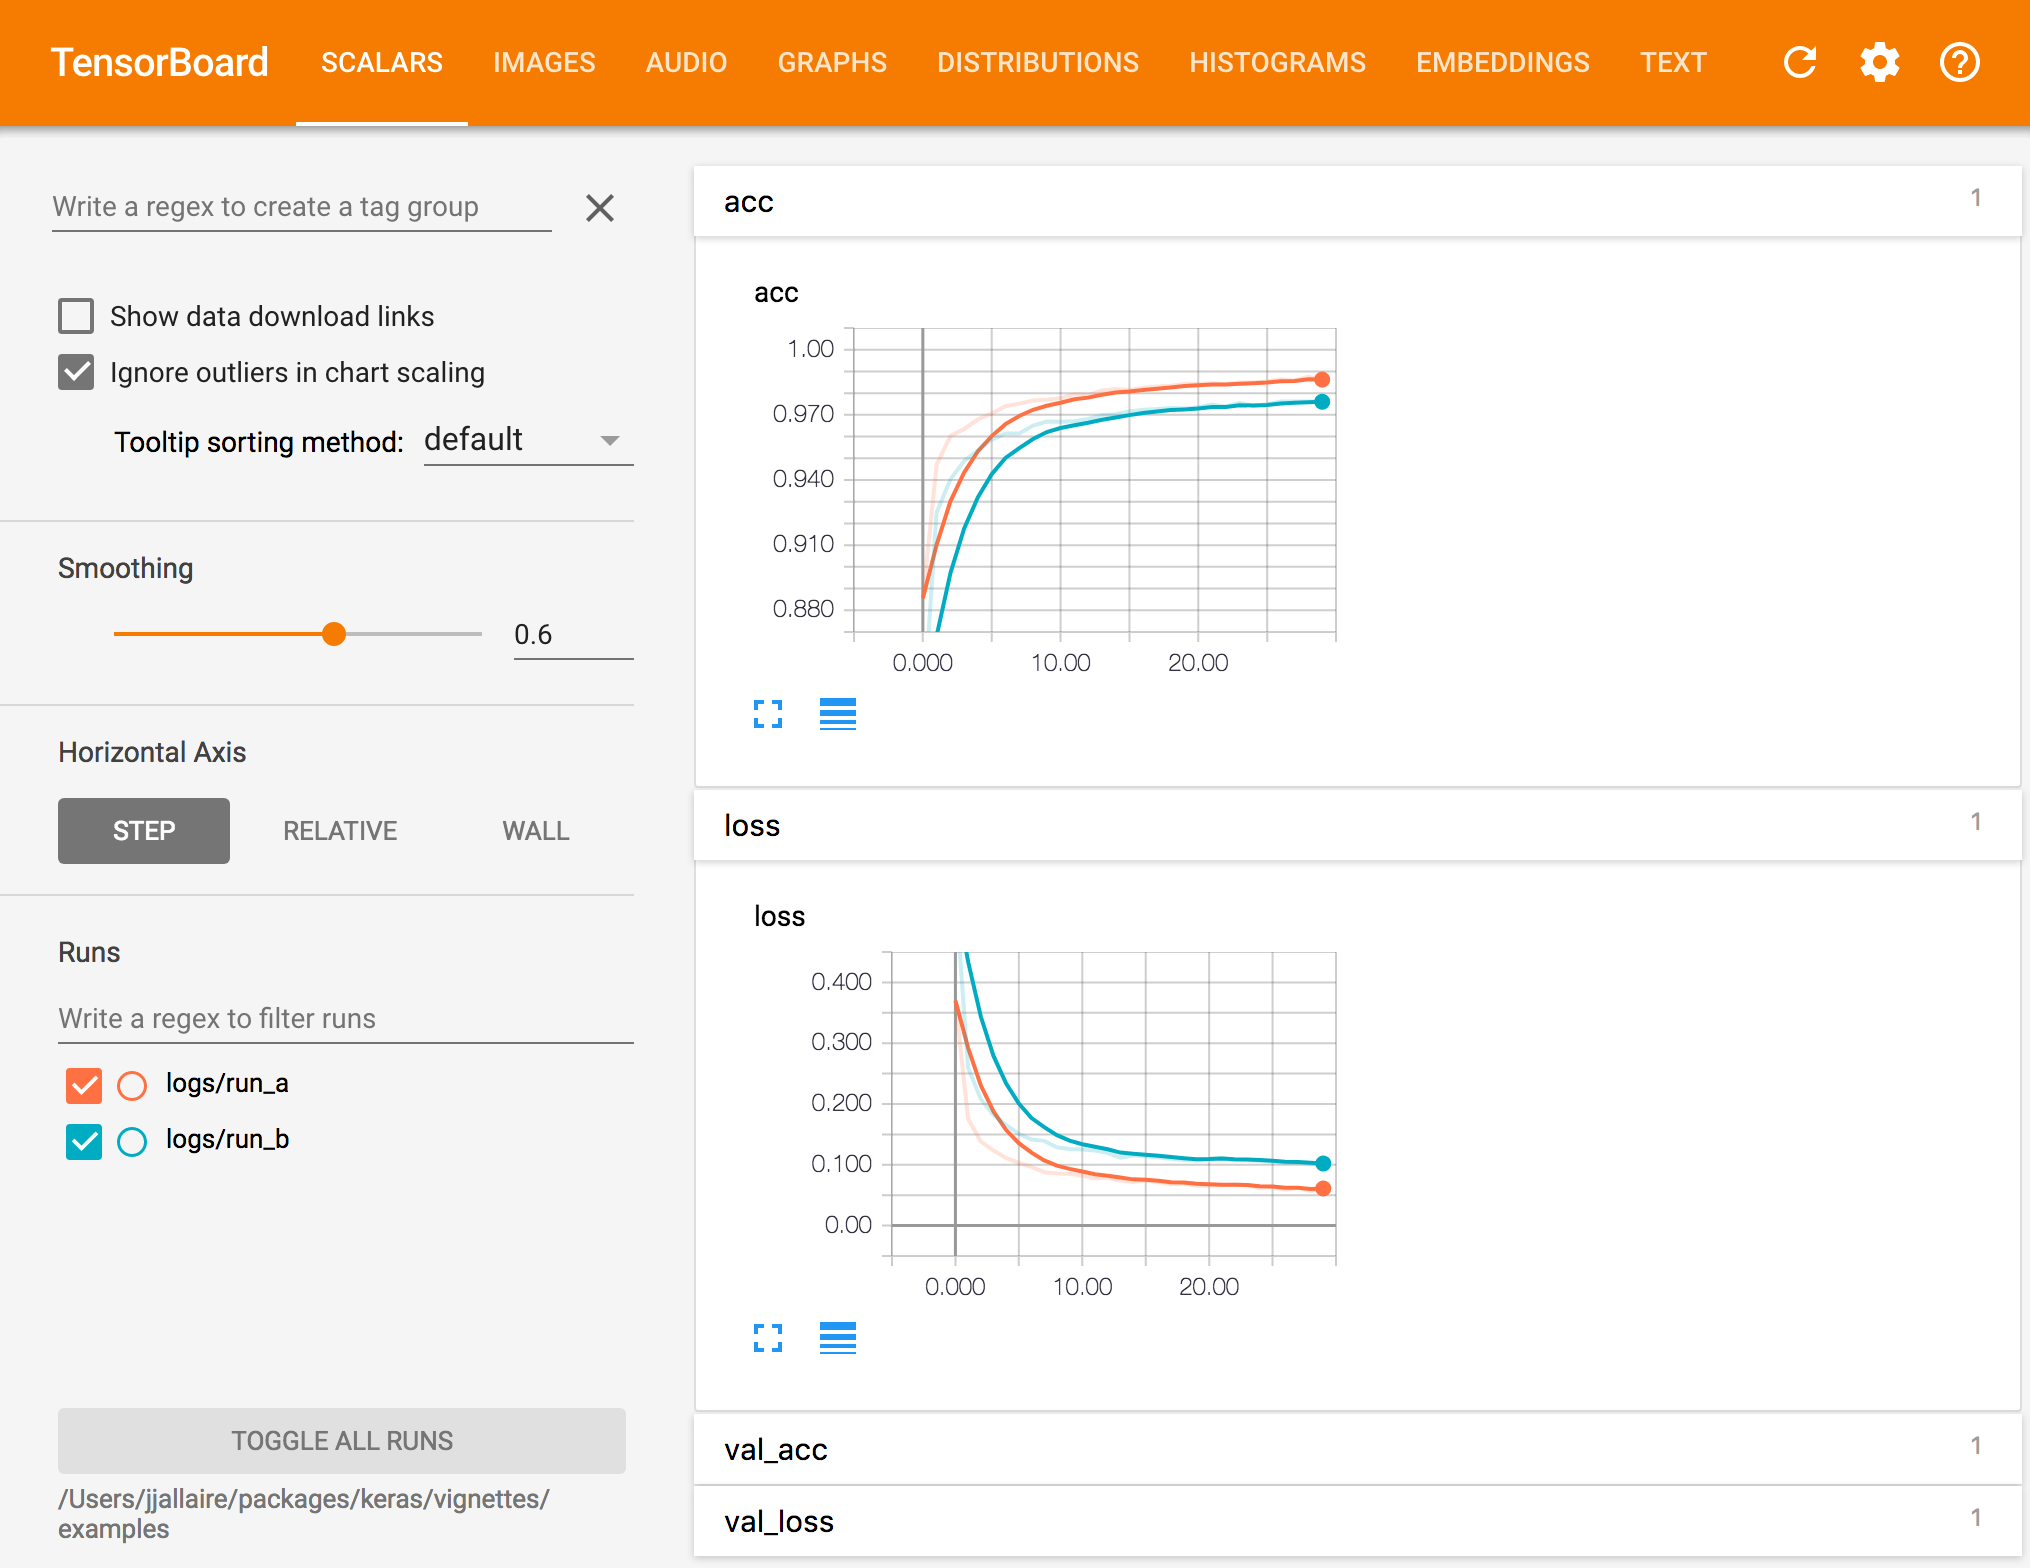
TensorBoard will automatically include all runs logged within the sub-directories of the specified log_dir, for example, if you logged another run using:
callback_tensorboard(log_dir = "logs/run_b")Then called tensorboard as follows:
tensorboard("logs")The TensorBoard visualization would look like this:

You can also pass multiple log directories. For example:
tensorboard(c("logs/run_a", "logs/run_b"))tfruns
If you are using the tfruns package to track and manage training runs then you easily pass multiple runs that match a criteria using the ls_runs() function. For example:
tensorboard(ls_runs(latest_n = 2))         # last 2 runs
tensorboard(ls_runs(eval_acc > 0.98))      # all runs with > 0.98 eval accuracy
tensorboard(ls_runs(order = eval_acc))[5,] # top 5 runs w/r/t eval accuracy